When you trade binary options, trendlines are one of the most common tools you can use. You can use trendlines, which are a part of technical analysis, to make a detailed trading plan.
If you want to use trend lines in binary option trading, you need to know how this technical analysis tool works at its most basic level. You should also learn about the different ways to use trendlines and the right way to draw them.
What Is a Trendline?
A trendline is a technical tool you can use to study the binary options trading market. It is mostly used for trading that goes up and down. Trendlines are easy to draw and give useful information for trading.
Two lines showing the market’s high and low prices go in the same direction as the price of an asset. The trendline is the line that joins higher highs and higher lows. In this case, the trendline with higher highs is also called the resistance line, while the trendline with higher lows is called the support line.
Types
A trendline shows how an asset is moving in the market. It’s broken up into three groups: downtrend, uptrend, and no change.
Uptrend
When the price of a commodity moves in an upward direction, this is called an uptrend in the trendline. In this trend, both the lowest and highest prices of an asset keep going up.
An uptrend in the trading market can last anywhere from a few weeks to a year. This trend is also an indication of a bull market since you can buy commodities to make more money.
Downtrend
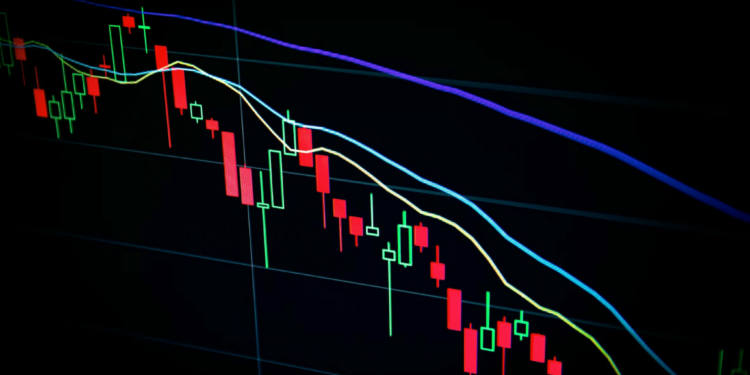
A downtrend is the opposite of an uptrend in every way. It’s a financial situation in which the value of an asset goes down over time. In this trend, both the low and high prices keep going down.
If the market doesn’t meet the conditions, the downtrend can turn back into an uptrend. Traders also like to sell to make money when the market is going down.
Sideways Trend
The last kind of trend goes in a straight line. It’s a type of financial situation where the price of an asset only goes up or down by a small amount. It is also called the horizontal trend.
As a trader, you can make money from a trend that stays the same. When the price of an asset is near the resistance level, you can either set a stop loss or look for a breakout or breakdown.
How to Draw the Best Trendline?
You can find the lowest low and the next lowest low in a bullish trend. Then you can connect the two points with a line. In the same way, you can find the highest high and the next highest high in a bearish trend and put a line between them.
After drawing the line, it’s easy to see the outer and inner trends. In this case, the outer trend is the limit that the asset’s price struggles to break through. And the inner trend shows how the market is moving and what the signal is.
It’s fine to cut through the wick when drawing trendlines. But you should never cut through a candlestick’s body. Also, if there are three points of contact, it means the trendline is moving.
Use of Trendline
When you trade binary options, you can use trendlines to your advantage. You can do this by following a few steps. Begin by finding something you own. Then, pay attention to the asset’s movement in a rhythmic way. Now, draw the trendline and pay attention to how the price of the asset changes.
Remember that prices change quickly on the binary options market, which makes it volatile. You shouldn’t assume that the price of an asset will stay close to the trendline, as that could lead to a bad trade. There are two main ways to use trendlines when trading binary options. These are support or resistance and price break.
Support or Resistance
Once you know where the trendline is and whether it is acting as support or resistance, you can get into the market. After the asset goes back to its original value, you can use the trendline to trade.
Depending on your trading strategy, you can also put a stop loss on the other side of the trendline.
Trendline Break
A trendline can also be used to trade binary options in a way called a “trendline break.” When you use this method, the entry should be based on a real breakout.
When a price breaks through a trendline, you can assume that the price of the asset will continue to move in the opposite direction. You can use either the aggressive entry or the conservative entry to enter a trendline break.

Conclusion
If you want to trade binary options, a trendline is a great tool to use. But to trade well, you need to know how to draw a trendline and how to use it to trade. You also need a clear plan and should wait and watch before trading to avoid losing money.


Discussion about this post